NotesMember Intelligence3 mins read498 words
Why Your Member Directory Should Look Like a Network, Not a Spreadsheet
 Virre Team · September 10, 2026
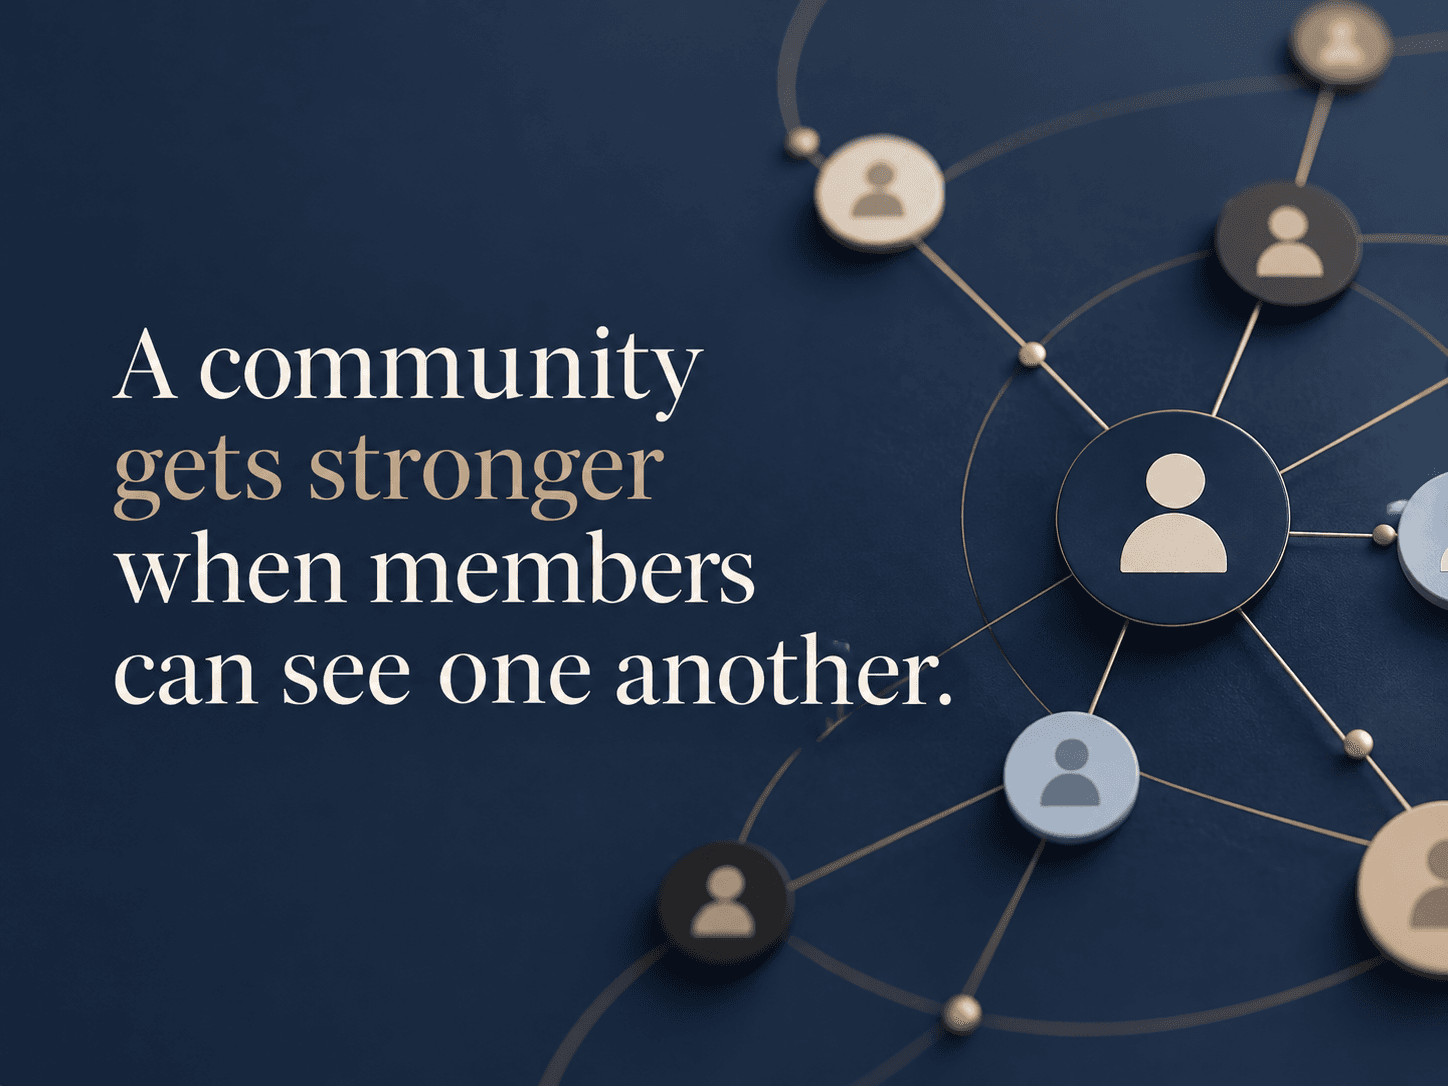
Most member directories answer a basic question well: “Who is in this community?” The harder question is the one community managers actually wrestle with every week: “How are these people connected, and where is the value between them?”
A table can show 1,200 members. It cannot easily show that twenty-three founders are entering healthcare, six investors overlap with those founders, three members sit between two otherwise disconnected groups, and an entire regional chapter has almost no connection to the rest of the network.
01A directory is a list. A community is a system.#
Member directory software from Higher Logic, Hivebrite, Bettermode and other community platforms makes it possible to search by profile attributes, browse members and discover people. Those are core capabilities and they solve an important problem.
But community managers often need a second view. They need to see the structure of the group itself. Which members share industries? Which people attended the same program? Where do mentoring relationships exist? Which communities or chapters overlap? Who is connected to everyone, and who is connected to almost no one?
Virre's graph-style member view is designed for this system-level question.
02Why a graph changes what you notice#
Suppose you run a 600-member executive community. In a list, each member appears as one record. In a graph, patterns begin to emerge: clusters by industry, geography, company, role, event attendance or stated goal. You can spot a member who could connect two groups that rarely interact. You can identify a cohort with strong internal ties but almost no links to the rest of the community.
This is not decoration. It changes programming decisions. A community manager could create a dinner around a cluster that is forming naturally, introduce a bridge between two groups, or notice that new members are sitting on the edge of the network without meaningful connections.
03The comparison with traditional community platforms#
Higher Logic emphasizes searchable member directories. Bettermode offers member directories, profiles, filters and community analytics. Hivebrite combines rich profiles, directory and map experiences with recommendations and matching. These products make member discovery significantly better than spreadsheets.
Virre's point of difference is to make the relationship structure itself a first-class view, connected to goals and interactions rather than treating the directory as the endpoint.
04The metric behind the picture#
The prettiest network graph in the world is useless if it cannot lead to action. The useful version lets a community manager click a cluster, understand why people are grouped, identify common attributes, see missing connections and trigger an introduction or program.
That is when visualization becomes operational intelligence.
05FAQ
It is a member-discovery interface that represents members and relationships visually rather than only as rows or cards. The best versions let managers filter the network by role, industry, location, goals, events or other signals.
A directory focuses on individual profiles. A network map focuses on patterns between profiles, such as clusters, bridges and disconnected members.
It can help managers identify where introductions, onboarding or programming may be needed. The value comes from acting on the pattern, not merely displaying it.
Explore Virre for community leaders and managers: https://www.virre.ai/solutions/communities